Free for a limited time
Snugstar checks the assumptions, picks the test and tells you the numbers behind the choice, draws the graph with the stars already on it, and writes your methods paragraph. In your browser, with your data in your own Drive.
It runs the test you pick. Snugstar helps you pick it — and shows its working.
Snugstar tests normality and equal variances, decides between means and ranks, Student and Welch, and picks the multiple comparisons the way a statistician would — then shows you the numbers that decided it.
Every pair compared: Tukey. Every group against a control: Dunnett. After Welch’s ANOVA, when the spreads differ: Dunnett’s T3 for smaller groups, Games-Howell for larger ones. On ranks: Dunn. You can pick Holm-Šídák, Šídák, Bonferroni or Fisher’s LSD instead.

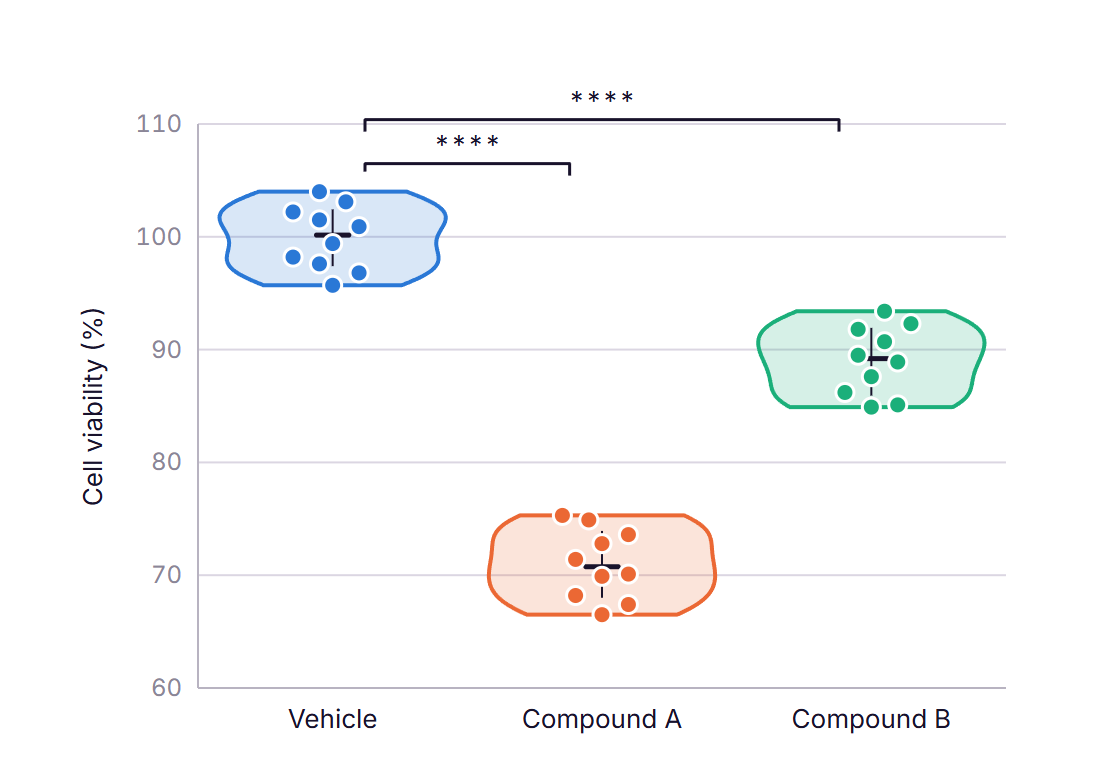
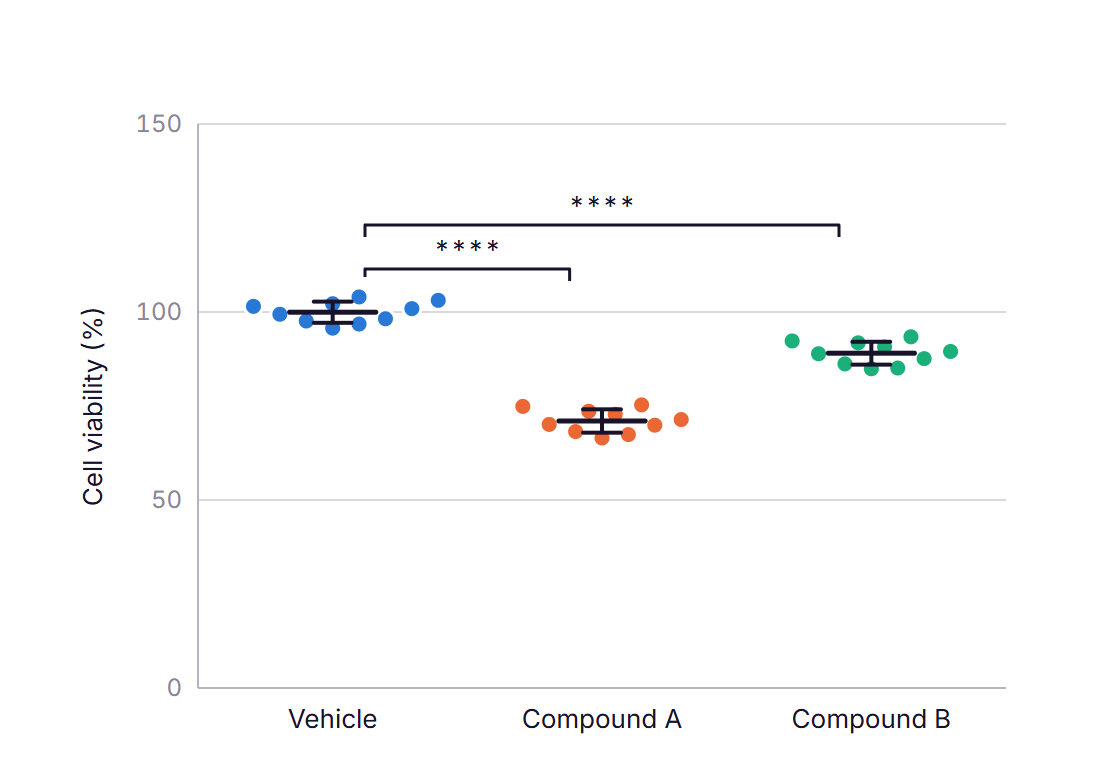
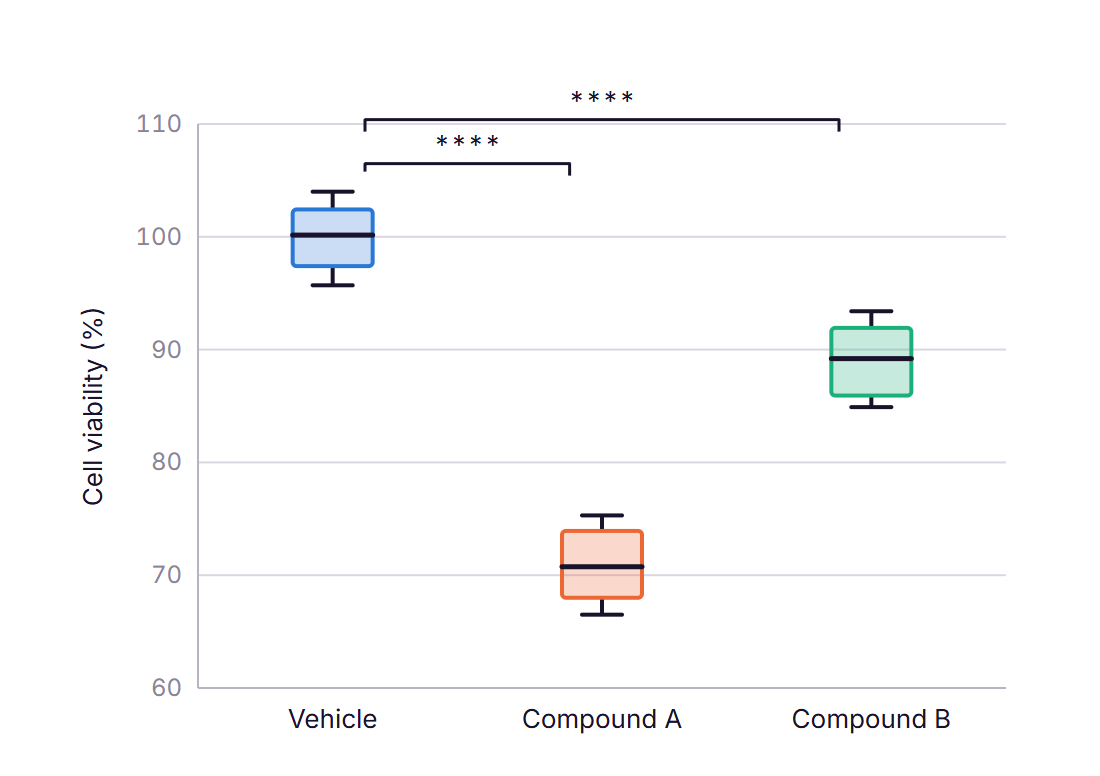
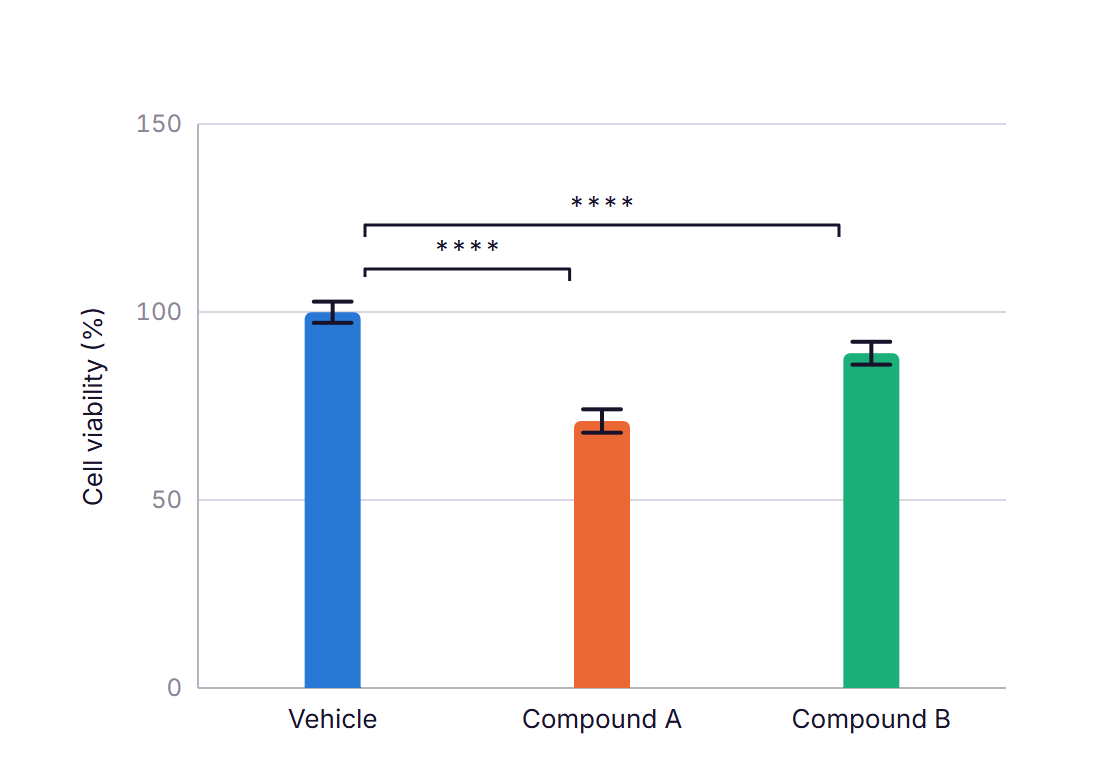
Scatter dot, bar, box and violin — with the significance brackets placed from the comparisons you ran. Download as SVG for a paper, a poster or slides.
Snugstar runs in your browser and saves your projects straight to your own Google Drive or OneDrive. We have no database for your data — there is nowhere on our side for it to go.
Google’s and Microsoft’s own consent screens show Snugstar can reach only the files it created or its own app folder — they enforce that, not us. Your browser’s Network tab shows your data going only to Google or Microsoft. The demo needs no account at all. The five checks, step by step →
Participant or patient data stays under your control, in your storage, never ours — so your ethics approval and your institution’s rules are the only ones that apply.
Can you see my data?
No — it goes to your Drive, never to us.
Can you open my other files?
No — Google and Microsoft block it.
Can I prove it?
Yes — open the Network tab and watch.
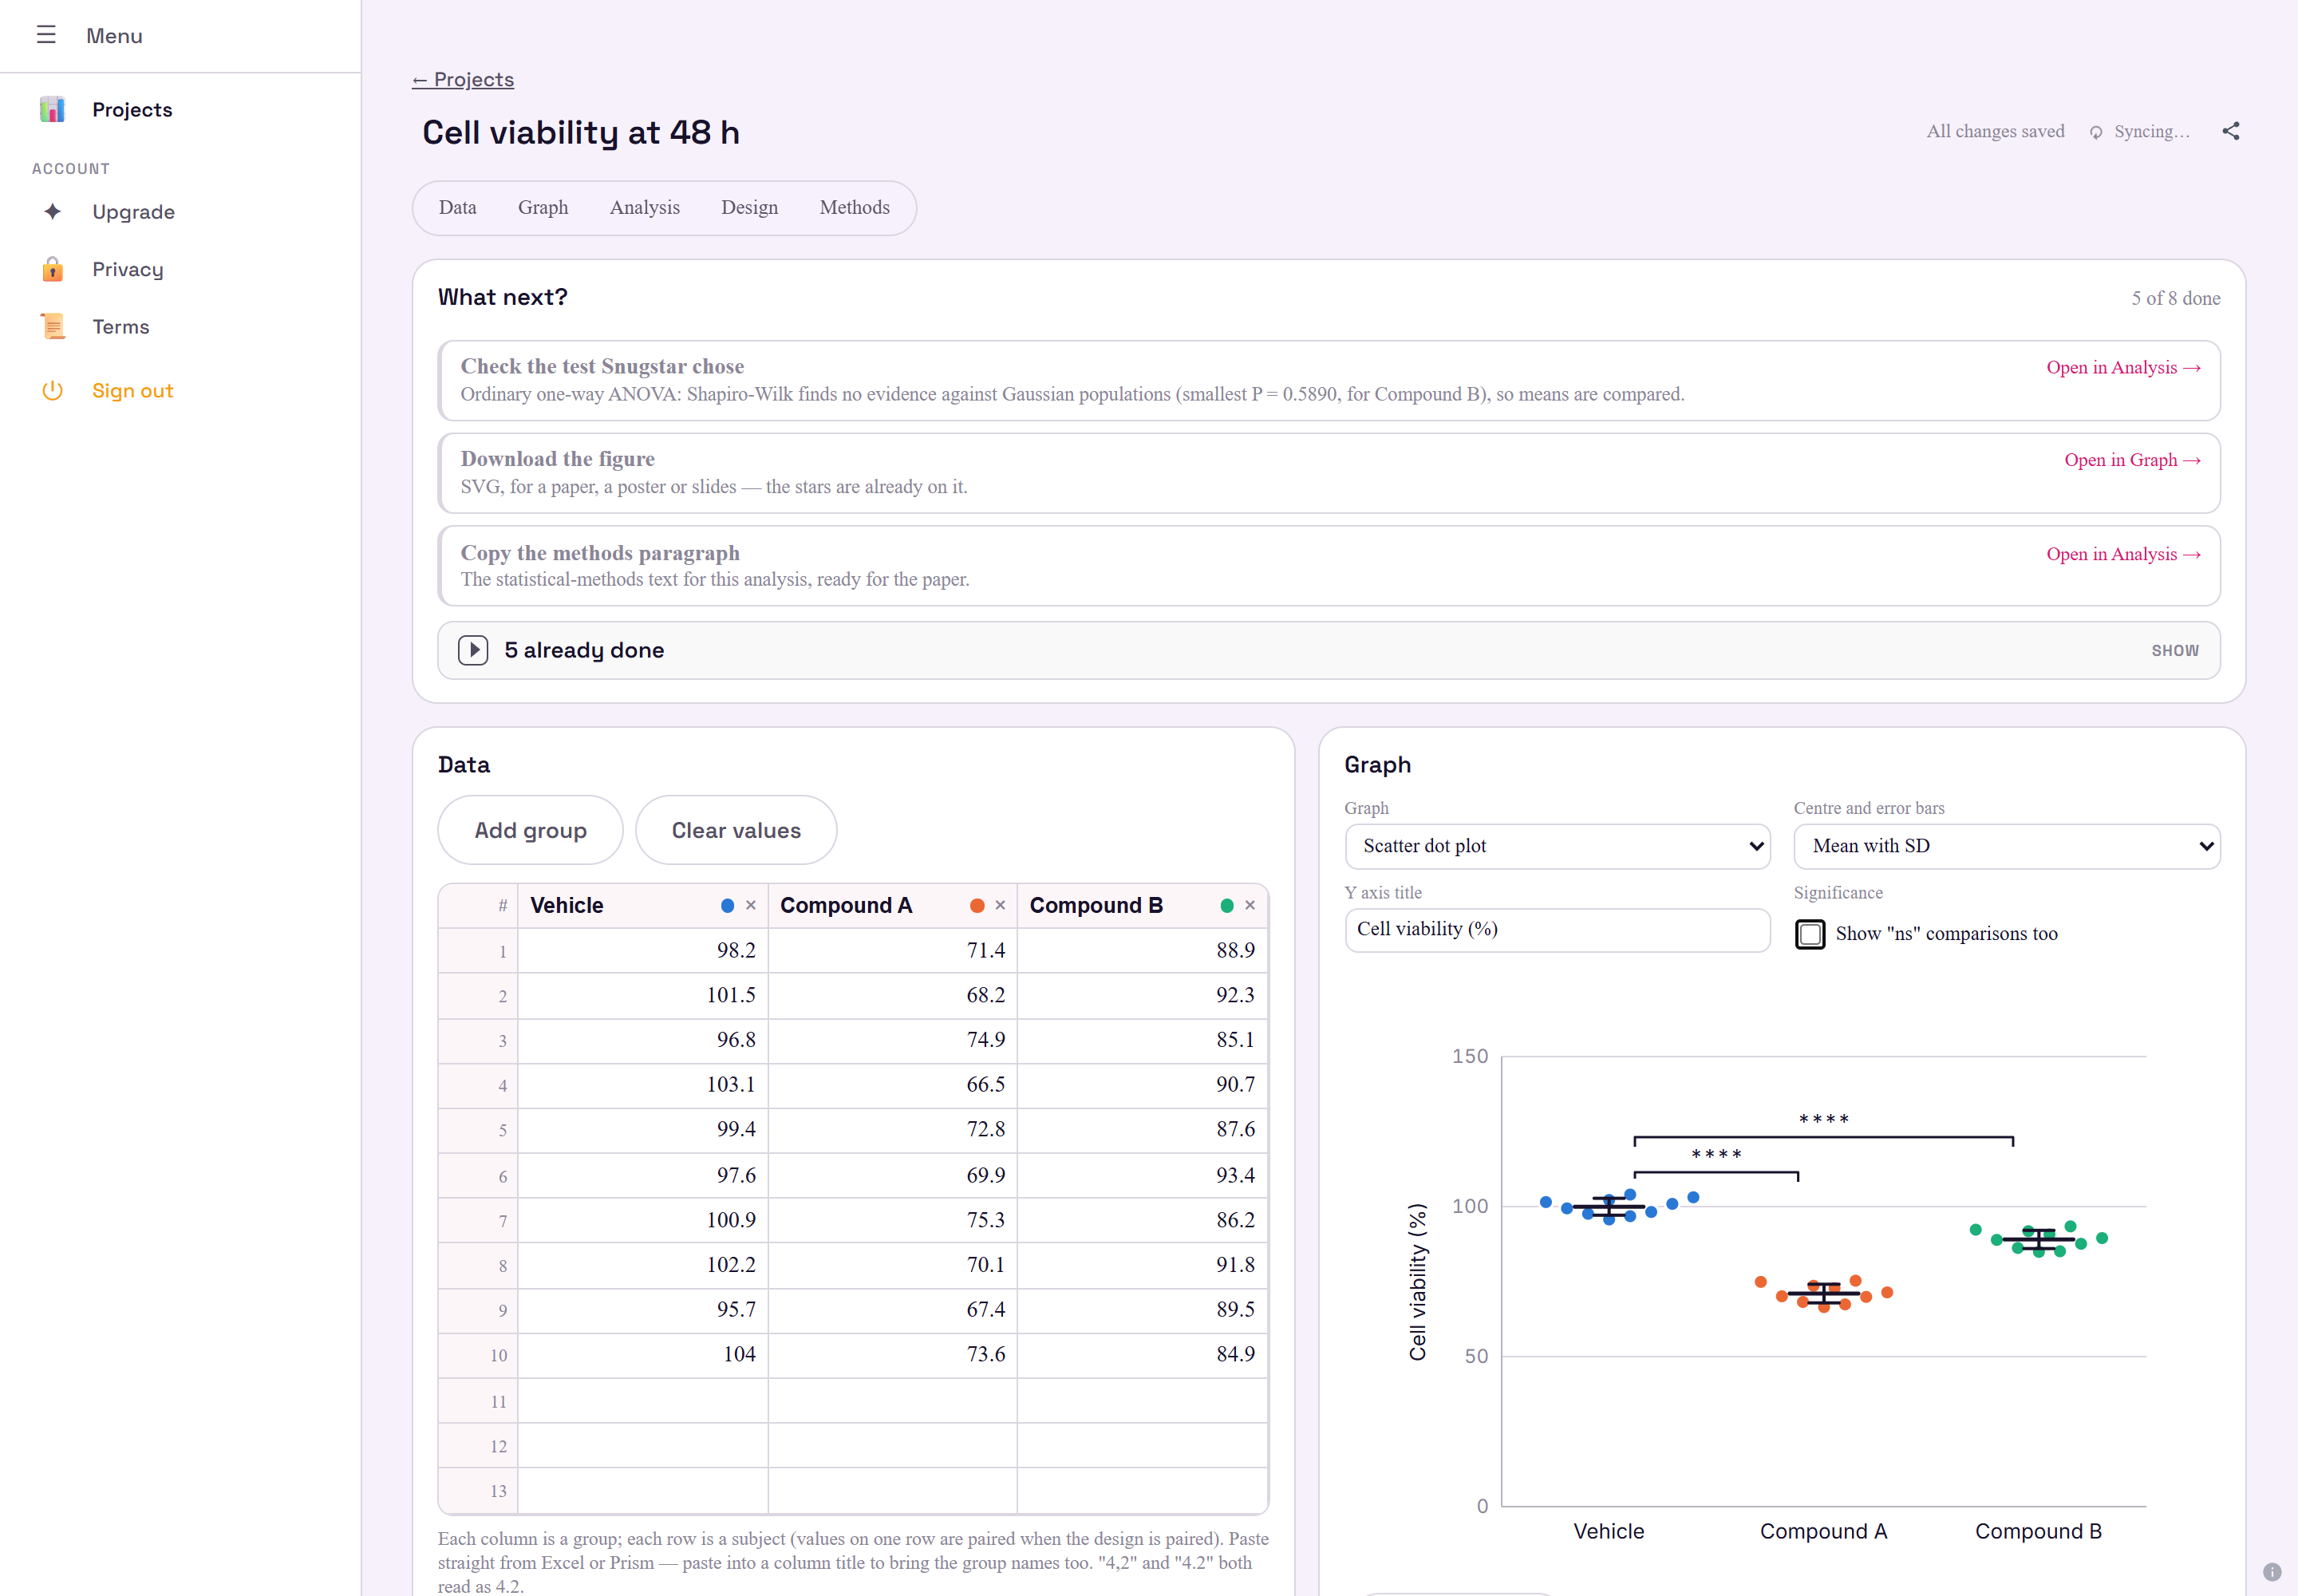

The tests, the sample sizes, the threshold — in the sentence a reviewer expects. And every table copies straight into Excel or Word.
Paste a column table straight from Prism or Excel — group names come too. The tests, the multiple comparisons and the graph types go by the names you already know.
Copy the columns in Prism or Excel and paste into any cell, or into a column title to bring the names. Blank cells stay blank; text such as “n.d.” is named and left out; “4,2” and “4.2” both read as 4.2.
Tap any line for the detail.
From Excel or Prism, into any cell — or into a column title to bring the group names.
“4,2” and “4.2” both read as 4.2. Text such as “n.d.” is named and left out, never silently counted.
Each row is a subject; say whether rows are matched and the paired tests follow.
n, mean, SD, SEM, 95% CI, median, quartiles, minimum and maximum — for every group.
D’Agostino-Pearson, Shapiro-Wilk and Anderson-Darling, side by side.
Brown-Forsythe and Bartlett, with every group’s SD.
Student’s or Welch’s, chosen from the F test — and it tells you which, and why.
For matched rows: before and after, left and right.
When the data are not normal: ranks instead of means.
One-sample t test or Wilcoxon signed-rank against the value you enter.
Ordinary, or Welch’s when the spreads differ — decided by the Brown-Forsythe test.
The rank-based alternative when the data are not normal.
Tukey, Dunnett, Dunnett’s T3, Games-Howell, Holm-Šídák, Šídák, Bonferroni, Fisher’s LSD and Dunn — each with adjusted P values and confidence intervals.
Scatter dot, bar, box and whiskers (Tukey’s rule) and violin, every point shown.
Mean with SD, SEM or 95% CI; median with interquartile range or range.
Brackets drawn from the comparisons you ran, stacked so they never overlap. Show “ns” too if you want it.
Sharp at any size, editable in Illustrator, Inkscape or PowerPoint.
The tests, the sample sizes and the significance threshold, in one paragraph to paste into your paper.
Every table copies as tab-separated text, straight into Excel or Word.
Each project’s next steps, in the order an analysis is done, each with its reason.
Data, Graph, Analysis, Design and Methods, one click away and never behind a wizard.
Projects are saved straight from your browser; we have no copy.
Only the files Snugstar created in Google Drive; only its own app folder in OneDrive — enforced by Google and Microsoft.
A working copy on your device keeps you going without a signal and syncs when it returns.
Everything works; nothing is kept once you close the tab.
XY data and curve fitting — linear and nonlinear regression, dose-response. Two-way ANOVA and repeated measures. Survival — Kaplan-Meier and log-rank. Contingency tables — chi-square and Fisher’s exact. Opening Prism files — paste the data for now. PNG export — SVG for now. They are coming, roughly in that order.
When we start charging for some features, it will be one affordable yearly subscription — a fraction of what desktop statistics software costs.
At snugstarapp.brainzie.co.uk — or try the demo with no account.
Sign in with Google or Microsoft. Your projects live there.
From Excel or Prism, group names included.
Design, test, graph, methods — each step says why.
Yes — for a limited time, every test and every graph is free, with no card to enter. When some features become part of a paid plan, we will say so here and in the app before it applies to you.
For column data, yes: t tests, one-way ANOVA, their non-parametric alternatives, multiple comparisons and the graphs that go with them, with the same names. You can paste your data straight from Prism. Curve fitting, two-way ANOVA and survival analysis are still to come. Snugstar is independent and not affiliated with GraphPad Software.
Unpaired, Welch and paired t tests; one-sample t and Wilcoxon signed-rank tests; Mann-Whitney and Wilcoxon matched-pairs; ordinary and Welch one-way ANOVA; Kruskal-Wallis; nine multiple comparisons tests; three normality tests; and the Brown-Forsythe and Bartlett equal-variance tests.
It tests each group for normality (Shapiro-Wilk) to choose between means and ranks, tests whether the spreads differ (the F test or Brown-Forsythe) to choose between the ordinary test and Welch’s, and picks the multiple comparisons from what you want to compare. It shows the P values and SDs behind every choice, and you can always choose another test.
In your own Google Drive or OneDrive, saved straight from your browser. We have no database for your data and cannot see it. Google and Microsoft limit Snugstar to its own files, and you can check every claim yourself — our privacy policy shows how.
Yes. Copy the columns and paste into any cell, or into a column title to bring the group names too. “4,2” and “4.2” both read as 4.2, and text such as “n.d.” is named and left out.
Yes. The graphs, tables and methods text you create are yours, to use in papers, theses, posters and slides with no attribution required. Download the graph as SVG for a sharp figure at any size.
We check every calculation against established reference statistical software, and every recommendation shows the numbers behind it so you can check it too. If you ever find a result that looks wrong, tell us — we treat it as the most serious kind of bug.
It runs in any modern browser on Windows, Mac, Linux or a Chromebook, with nothing to install. A working copy on your device keeps it going without a connection.
Not yet. XY data with linear and nonlinear regression come next, then two-way ANOVA, survival analysis and contingency tables. Tell us which you need first.
Open snugstarapp.brainzie.co.uk, sign in with Google or Microsoft (or try the demo with no account), paste your data and follow “What next?”.
Still have a question, or an analysis you need? Ask us — it comes straight to the person building it →
The right test, the reasons, the graph and the methods — in five minutes, with your data in your own Drive.
Start your first analysis